
Recent
Georgia Exports – On Track for Topping $40 Billion in 2018
·697 words·4 mins
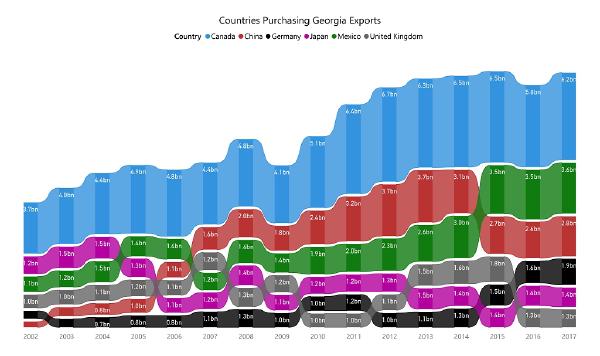
Export goods originating from Georgia reached an all-time high-mark of $39.4 billion in 2014. As a state, Georgia has been trying to exceed that banner year ever since. Recent talk of tariffs and revisions to NAFTA have caused many Georgians to wonder what effect this may have on our economy. We will have to wait until February 2019 for the US Census Bureau to publish complete 2018 export totals. But currently available data can help us understand the role that exports have in Georgia’s economy and what countries dominate as our trade partners. In 2017, Georgia’s export economy was the 12th largest of the 50 states. Over 15 years’ time, the dollar-value of goods originating from Georgia and sold abroad has grown 2.5 times. In 2002 exports totaled $14.4 billion. By 2017 they had grown to $37.2 billion.
Georgia Exports - Primer on Using Census Data
·318 words·2 mins
Our company is interested in exporting our products. What data sources are available and how can we evaluate our prospects?
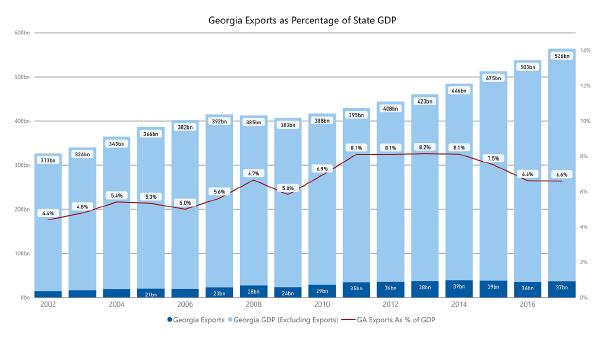
The U.S. Census Bureau has a wealth of information for evaluating both domestic and international markets. In this series of blog articles, I’ve documented the methods for retrieving Census export data and analyzing it in Power BI. Topics include: the product classifications used by the Census, the mechanics for retrieval and how Power BI and the Tabular data model can make quick work of a 5 million row data set. Viewed in aggregate, you can see that exports have an important and growing role in our state’s economy (graph below.) That data really comes alive when you can drill down and explore data trends in your own industry.
Change over Time Analysis in Power BI
·717 words·4 mins
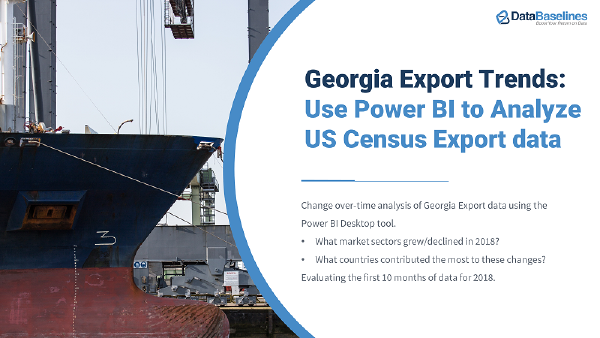
In an earlier post I showed you a Power BI interface for summarizing Georgia export data from the US Census Bureau. If your primary interest is year totals, that model is useful for understanding our State’s export economy. But there are some questions that particular Power BI model does not answer. In particular, it does not address change over time questions like: What product categories have the greatest gain or loss? What countries were responsible for those gains and losses? This blog article and an accompanying video explain how the updated version of our Power BI model address these questions. The video takes you step-by-step through the system. The paragraphs and images below are a quick orientation for you. Note: clicking the images will increase their size.
Trade Data via the Census API and SSIS
·1135 words·6 mins
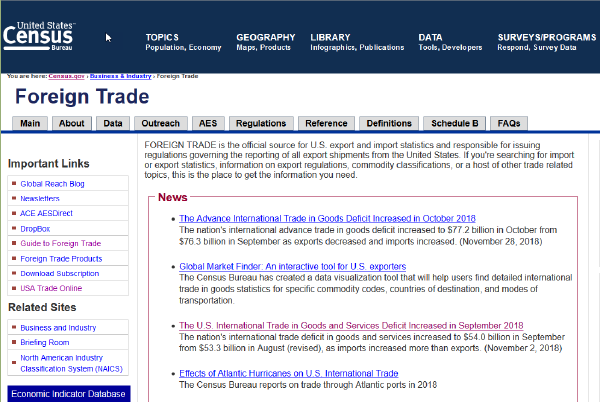
This article continues an exploration of the Census Trade data sets, but with an eye for doing larger “bulk-loading” of data the Census makes available. Specifically, we will:
Retrieve export data from the US Census by using their Application Programming Interface (API), Import the API-generated data file into a database using Microsoft SQL Server Integration Services. In a previous article, I described a method of generating export data using the Census USA Trade Online website. That method is great for initial discovery and extraction of one-time data. But if you are ingesting Census data on a recurring schedule - you need a process you can repeat easily and consistently. The Census API is useful for this purpose.
Georgia Exports in Power BI
·390 words·2 mins
Describing Export Statistics using Power BI # You may already know that Exports from Georgia contribute between $35-40 billion to our state economy each year. But have you ever wondered – What do these Georgia products look like? This blog article and attached video is an effort to answer that question. It uses a free tool from Microsoft called Power BI to slice and dice the detailed monthly export data that is available from the US Census. What Does the Power BI Tool Show? # I’ve previously retrieved this Census data for 2013-2018 and ended up with a 2.4 million row data set in SQL Server. While it is all well and good to have the raw data - the trick is putting that data in a format end users can easily navigate and learn from. On this score, PowerBI delivers.
Georgia Exports, A Tutorial for USA Trade Online
·907 words·5 mins
Trade exports accounted for $37 billion of Georgia’s economy in 2017. That translates to over 180,000 jobs in our state. With so many revisions to tariffs and NAFTA taking place, you may wonder: “What effect will these changes have on our State’s economy?” Starting with this blog article – I’d like to share what I’ve learned about the subject. Together, we’ll evaluate the most authoritative and detailed source of US import/export data that is available: the US Census Trade data. In this article I’ll show you how to extract data from the Census using USA Trade Online. This is an easy-to-use and powerful method of retrieving trade-related data. In later articles I’ll address:

Enterprise Architect for Documenting DBs
·115 words·1 min
The database documentation capabilities Microsoft provides for SQL Server databases are rudimentary. Pretty quickly you are going to be looking for a third party solution. In this brief video tutorial, I demonstrate how Enterprise Architect by Sparx Systems can be used to:
document columns in a table author more detailed explanations of the purpose of tables detect changes in a target SQL Server database Enterprise Architect has a large amount of additional capabilities for modeling business process and software development efforts. It’s a rather complicated tool quite frankly. But it is a reasonably priced product that can help your organization communicate about the nature of your data.

Atlassian Confluence for Technical Documention
·131 words·1 min
A video demonstration of Atlassian Confluence as a documentation alternative to Microsoft Word, SharePoint and OneNote.
For those not familiar, Confluence is a Wiki platform ideally suited for documenting technical topics. It offers “just-enough” editing capability on a page to deliver attractive, readable content. It is simple and efficient to author and organize content. Key benefits of the software:
Highly usable and simple to learn authoring environment Hierarchical organization into spaces and pages Heads-Up page authoring Plugin capabilities for diagrams, visuals Integration with JIRA task management Active-directory (AD) integration with configurable permissions Content stored in Microsoft SQL Server Inexpensive licenses for smaller workgroups In the video below, the author demonstrates Confluence using the personal wiki he’s revised over the past decade.

The Value of a Good Name
·140 words·1 min
Well it’s done – we have changed our company name to DataBaselines, LLC.
There are a couple of reasons for the name change. But the primary reason is symbolic. It marks a transition for our company. We no longer create any type of data entry applications. Our focus is squarely on business intelligence reporting and data science techniques.
Merriam-Webster will tell you that a baseline is a minimum or starting point used for comparisons. That dovetails neatly with our purpose. We help our customers:
Take better measurements – including their starting points, their baselines. Build tools to help them perform past their baselines and give measure to their success. We are excited about the future, and reflective about the past: